Statistics
Statistics helps platform managers monitor monetization and investigate changes by date, game, product, player, or ad placement. Open Statistics and choose one of the three reports: Platform Payments, In App Payments, or Advertising. Each report supports a date range, grouping, server-side sorting, pagination, and CSV export.
Platform payments
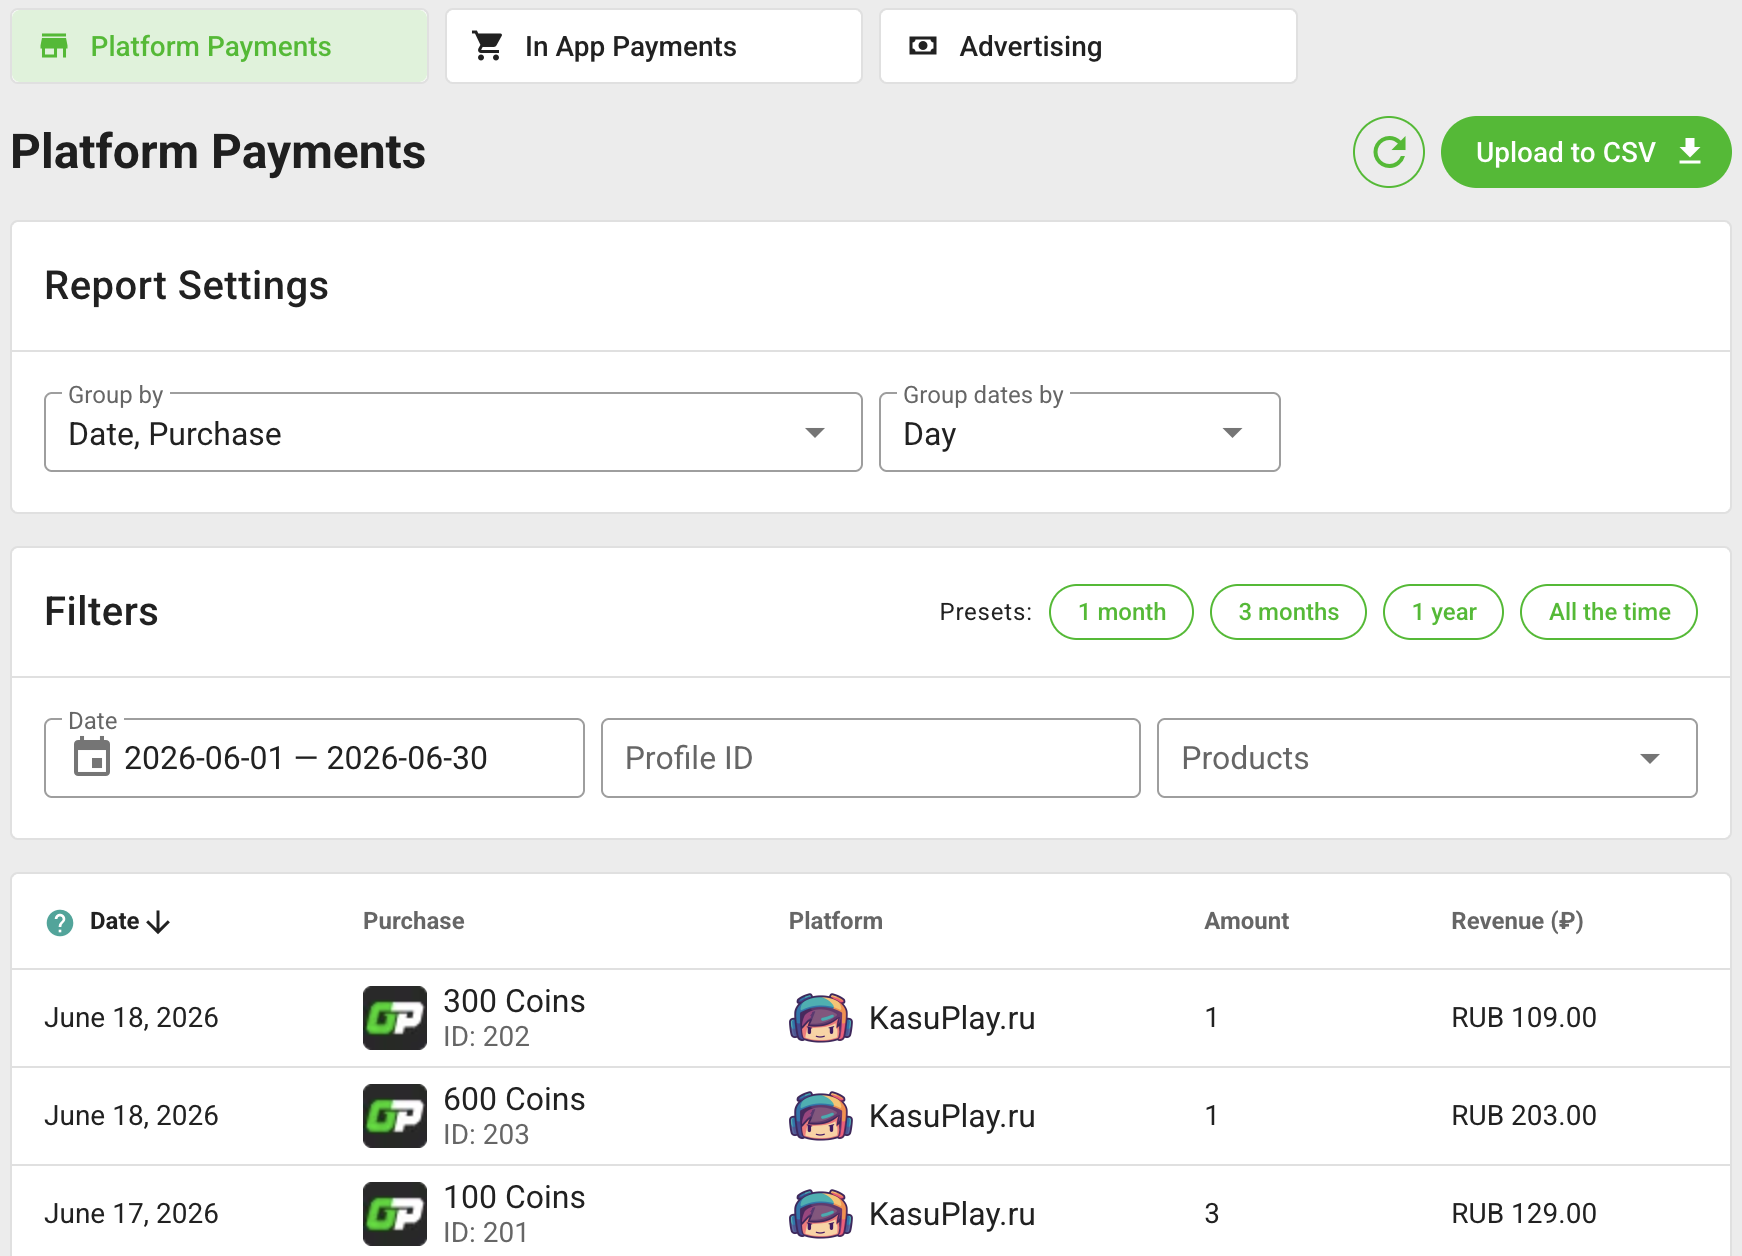
This report contains purchases made on the platform site, including currency bundles, VIP products, and other platform products. Group rows by date, product, or player profile; filter by date, profile ID, or product.
The table shows the number of recorded orders and their aggregated value in RUB or USD. Deleted products and profiles can still appear in historical rows without their current display data.
In-game payments
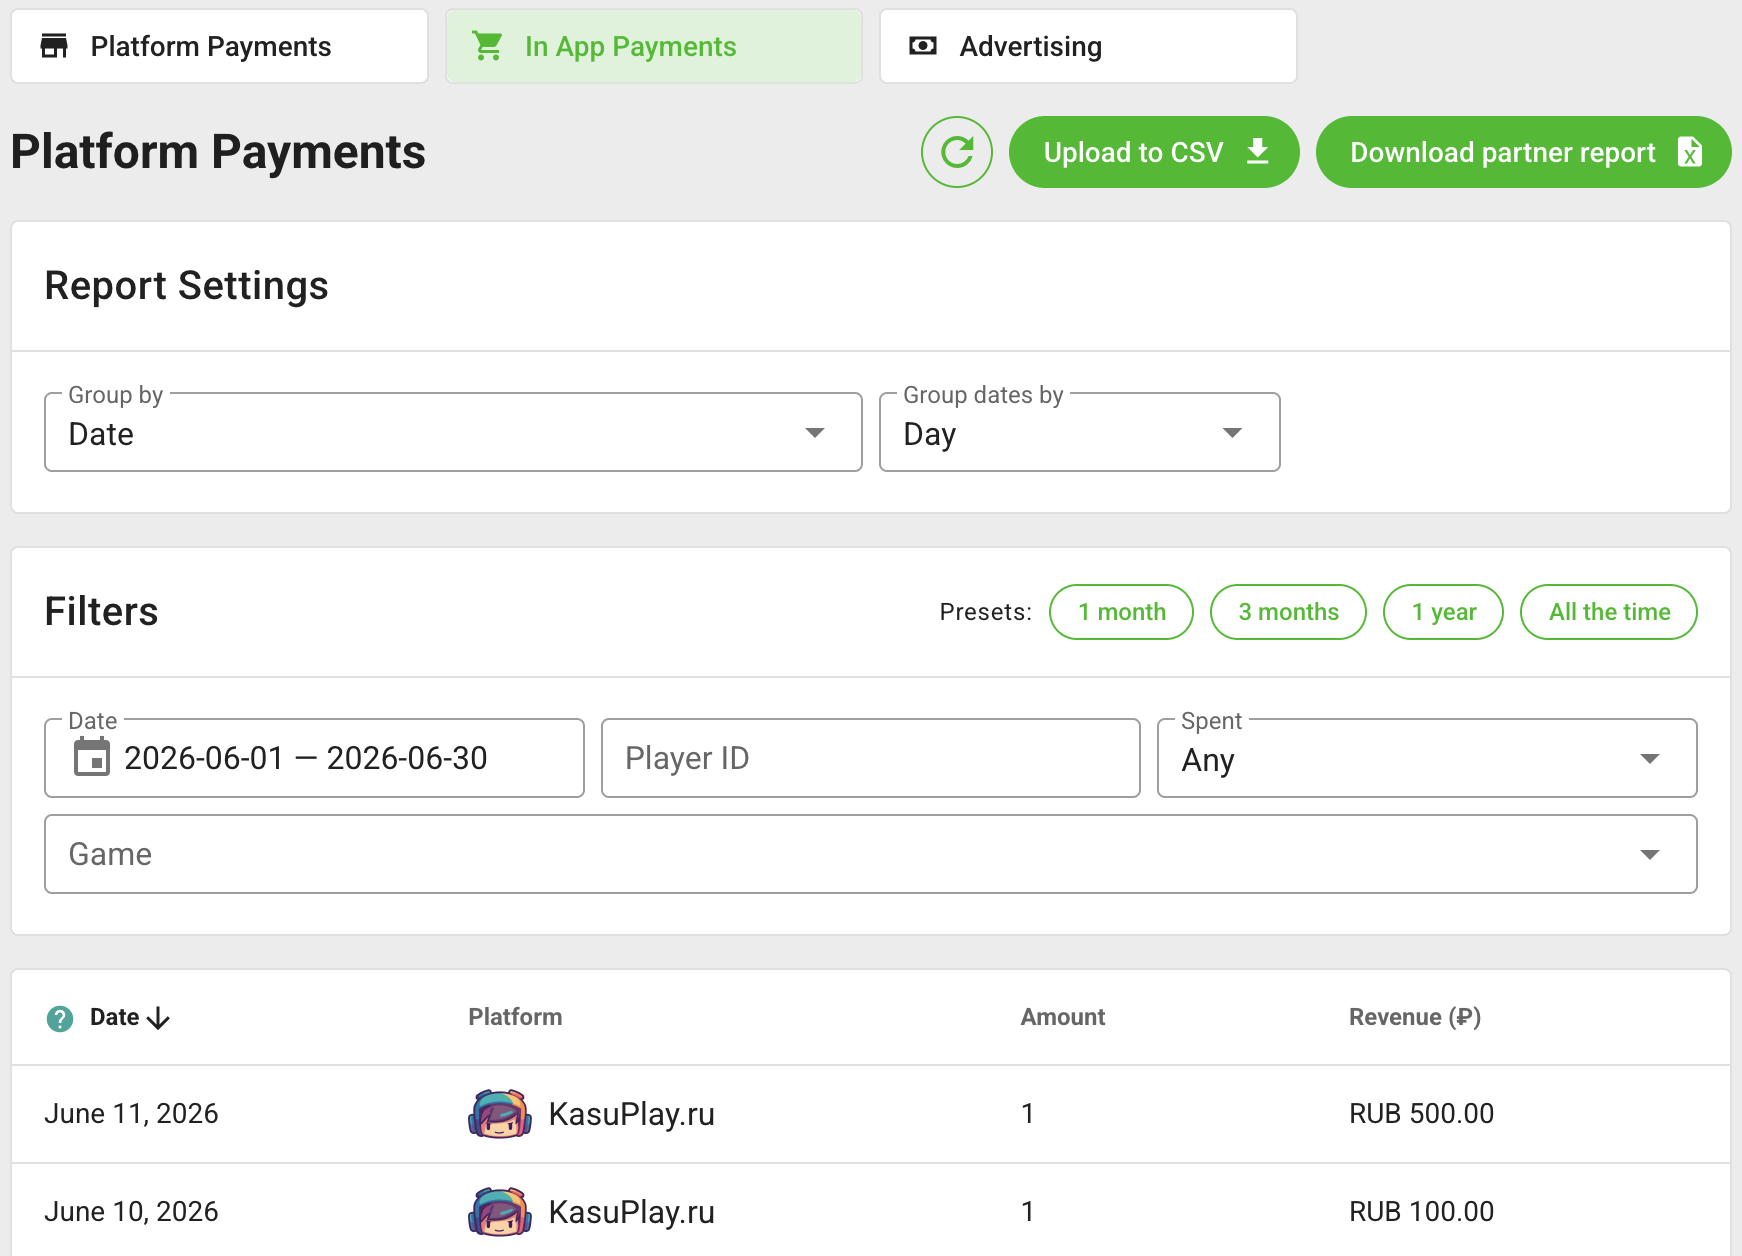
This report contains purchases made inside games opened from the platform. Group rows by date, product, player, game, platform, or consumed state. Filter by date, player ID, consumed state, or one or more games.
The consumed state tells whether a recorded purchase has been used by the game. It does not change the amount originally recorded for the purchase.
Advertising
The advertising report can be grouped by date, game, banner type, device, and revenue source. Filters are available for the date range, games, banner types, desktop or mobile devices, and sources such as RSYA or bidders.
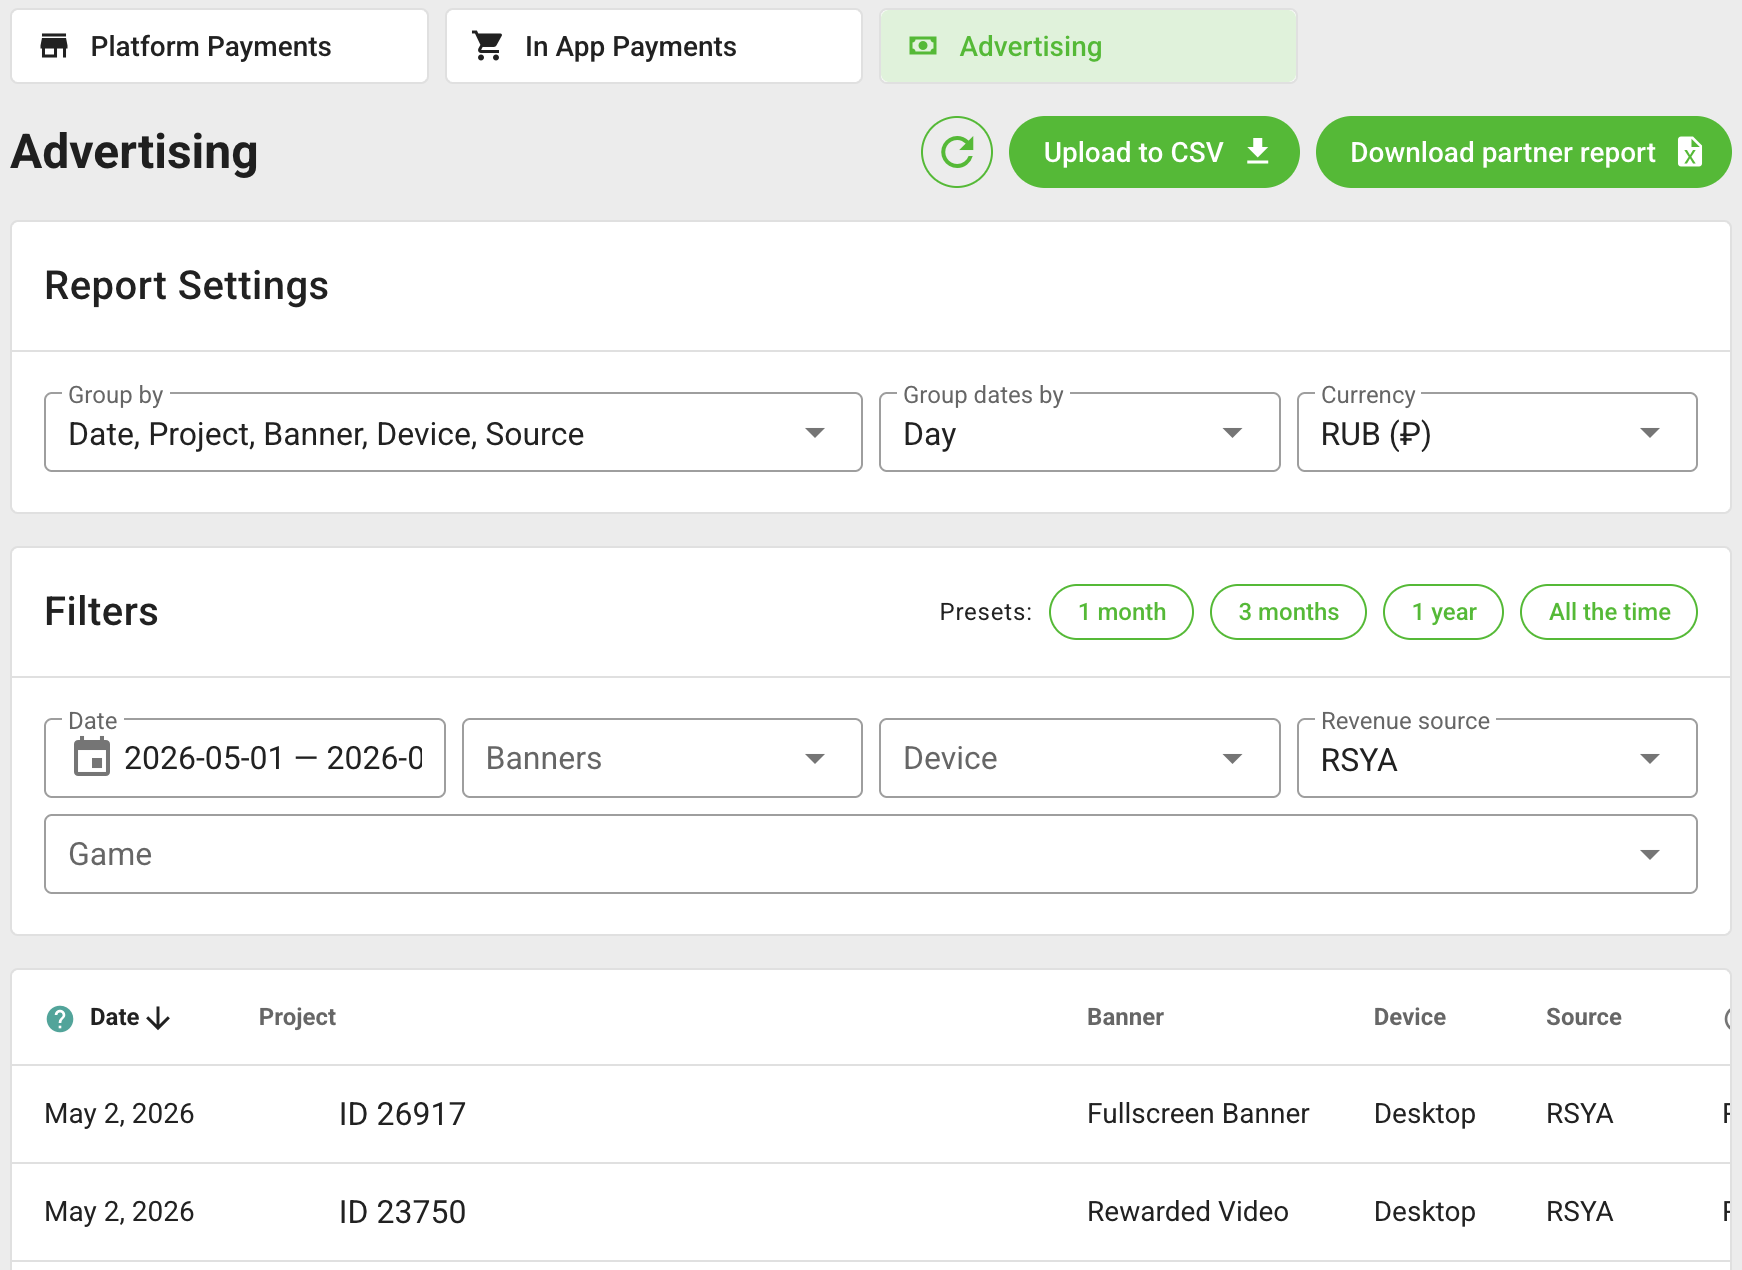
The table uses the following metrics:
| Metric | Meaning |
|---|---|
| Requests | Ad requests recorded for the selected dimensions. |
| Impressions | Impressions reported by the advertising pipeline. |
| Visible impressions | Impressions counted as visible. |
| Errors | Requests minus visible impressions. |
| Visible fill rate | The share of requests that produced a visible impression. |
| Revenue | Advertising reward for the selected rows. For RSYA, the panel reports the amount excluding VAT in RUB and can display its converted USD value. |
Use grouping by game and banner type to find placements with many requests but a low visible fill rate. A row with N/A revenue or fill rate has no value available for that combination of dimensions.
Read revenue correctly
The revenue columns answer how much revenue was recorded for the selected period and grouping. They are reporting values, not a final settlement statement. Payment-provider fees, refunds, chargebacks, taxes, currency conversion, and contractual revenue sharing may affect the amount actually paid.
Use the advertising or payment-provider settlement report for financial reconciliation. Keep the same date range and currency when comparing it with the GamePush table.
Build and export a report
- Select the report and date range. Presets are available for common periods.
- Choose dimensions in Group by. When date is selected, choose day, month, or year.
- Apply filters and click the refresh button.
- Click a supported column header to change sorting.
- Click Upload to CSV to export all rows that match the current report settings.
The date column includes a timezone hint. Use the same boundaries when comparing reports from different systems. For programmatic reporting, see the Statistics API.